
Bitbrain SennsMetrics
A step forward in the data analysis of human behavior, with a complete, flexible, and practical solution developed for applied research.

Get more information
If you have any questions about this product, do not hesitate to contact us.
A step forward in data analysis
SennsMetrics is a data analysis tool that includes a wide range of emotional, cognitive and behavioral metrics. It provides an additional layer of data processing to segment, analyze and visualize your results through its flexible and intuitive tools.
Use experimental design templates and record your study with SennsLab, decode your data with SennsCloud, and analyze and visualize your results with SennsMetrics, covering the entire workflow of your research.

Wide range of metrics
Obtain meaningful metrics of emotional, cognitive, and behavioral data to enhance the analysis of your results.

Powerful analysis tools
Flexible and intuitive analysis tools to segment, edit, and visualize your data, to cover all your analysis needs.

Advanced visualizations
Unique visualizations that combine the metrics of multiple sensors to draw the full portrait of the participant reactions.


Any kind of stimuli presentations

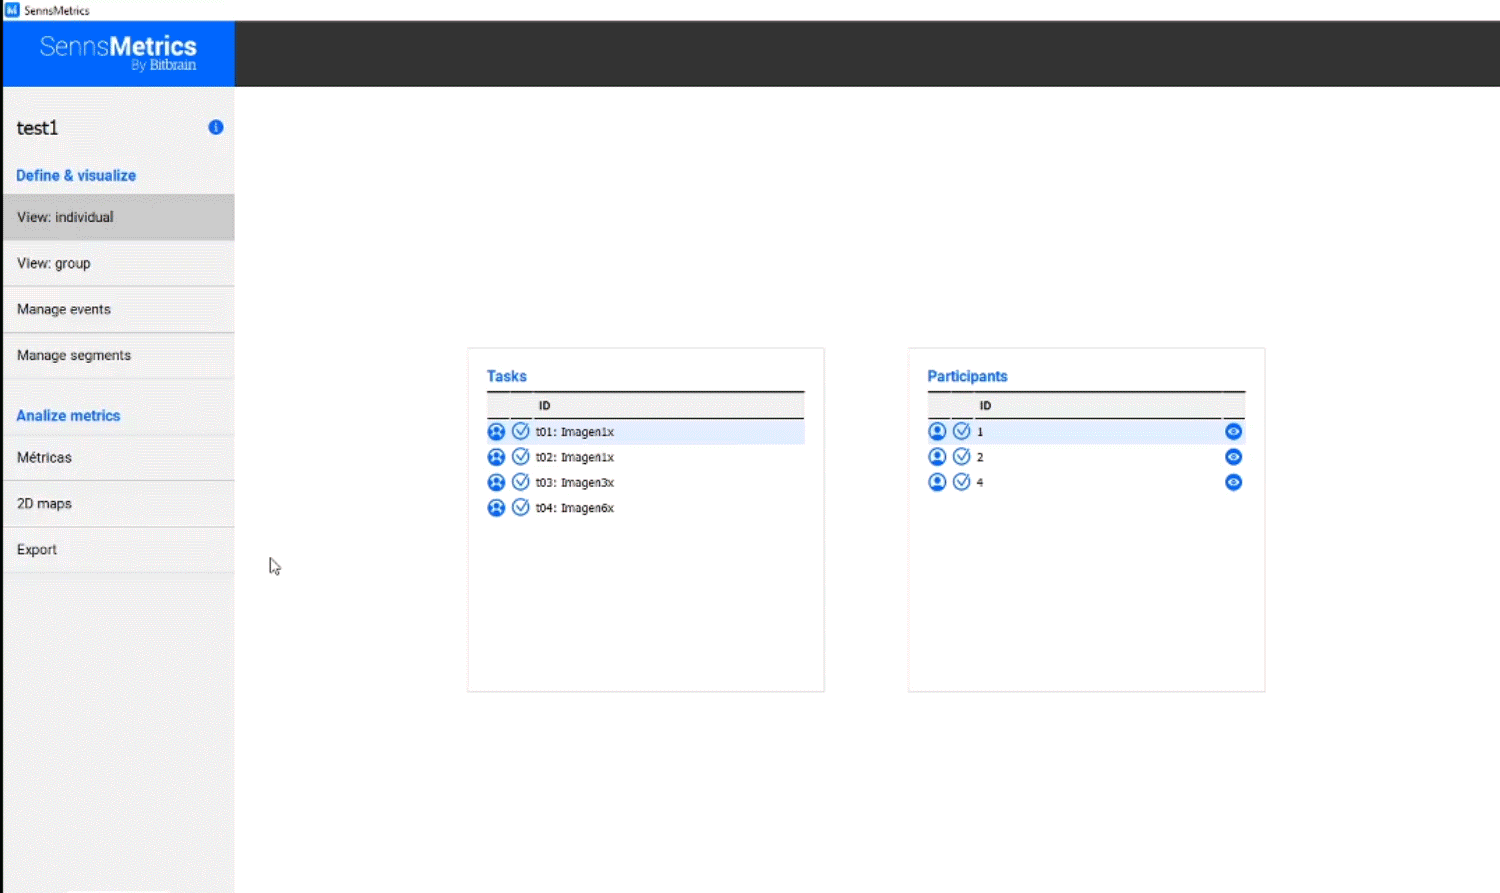
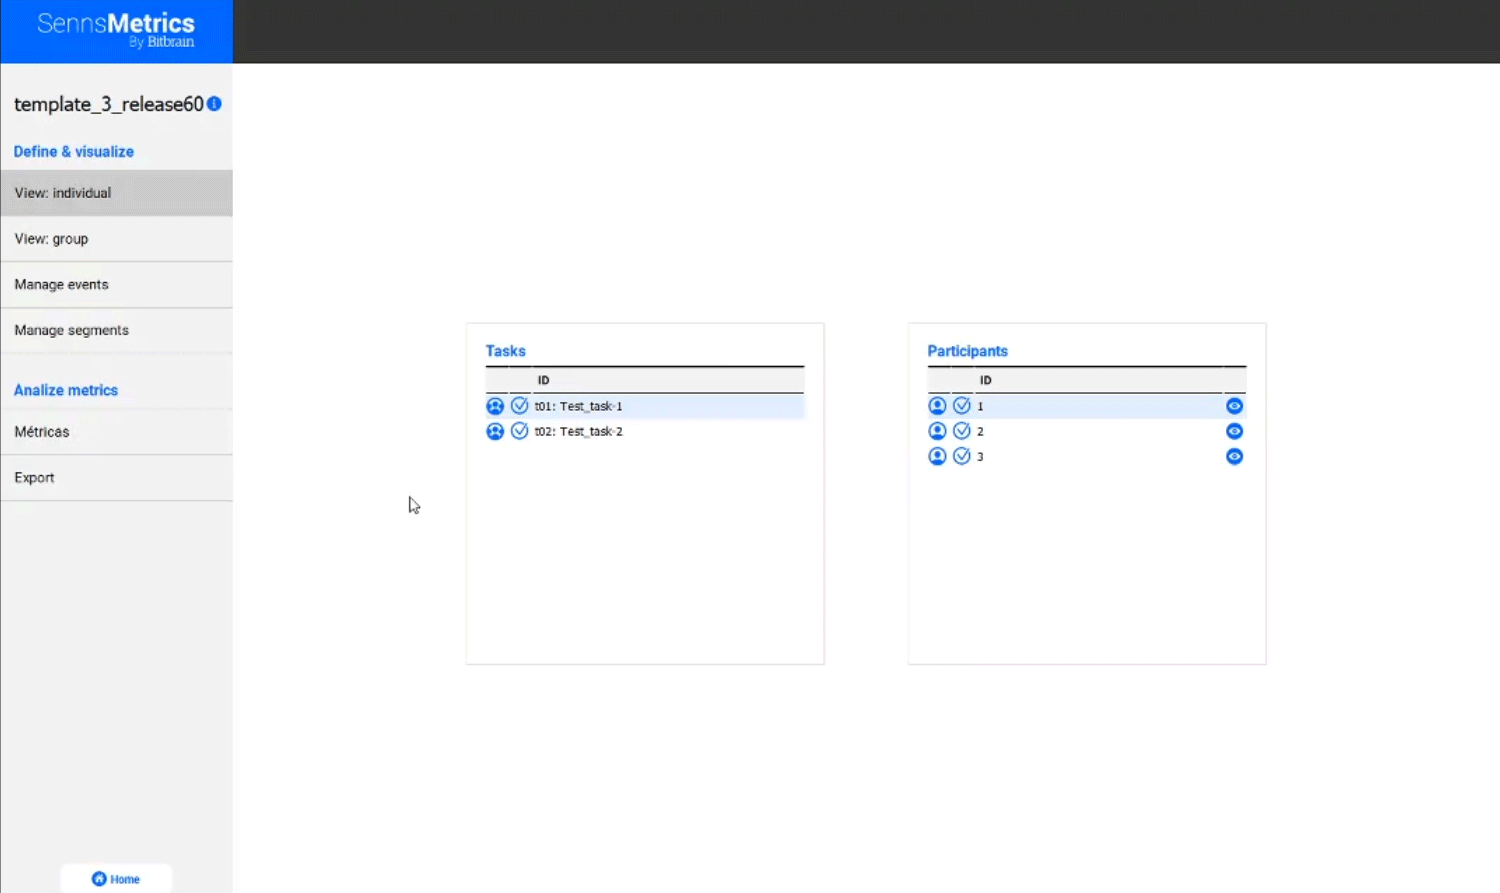
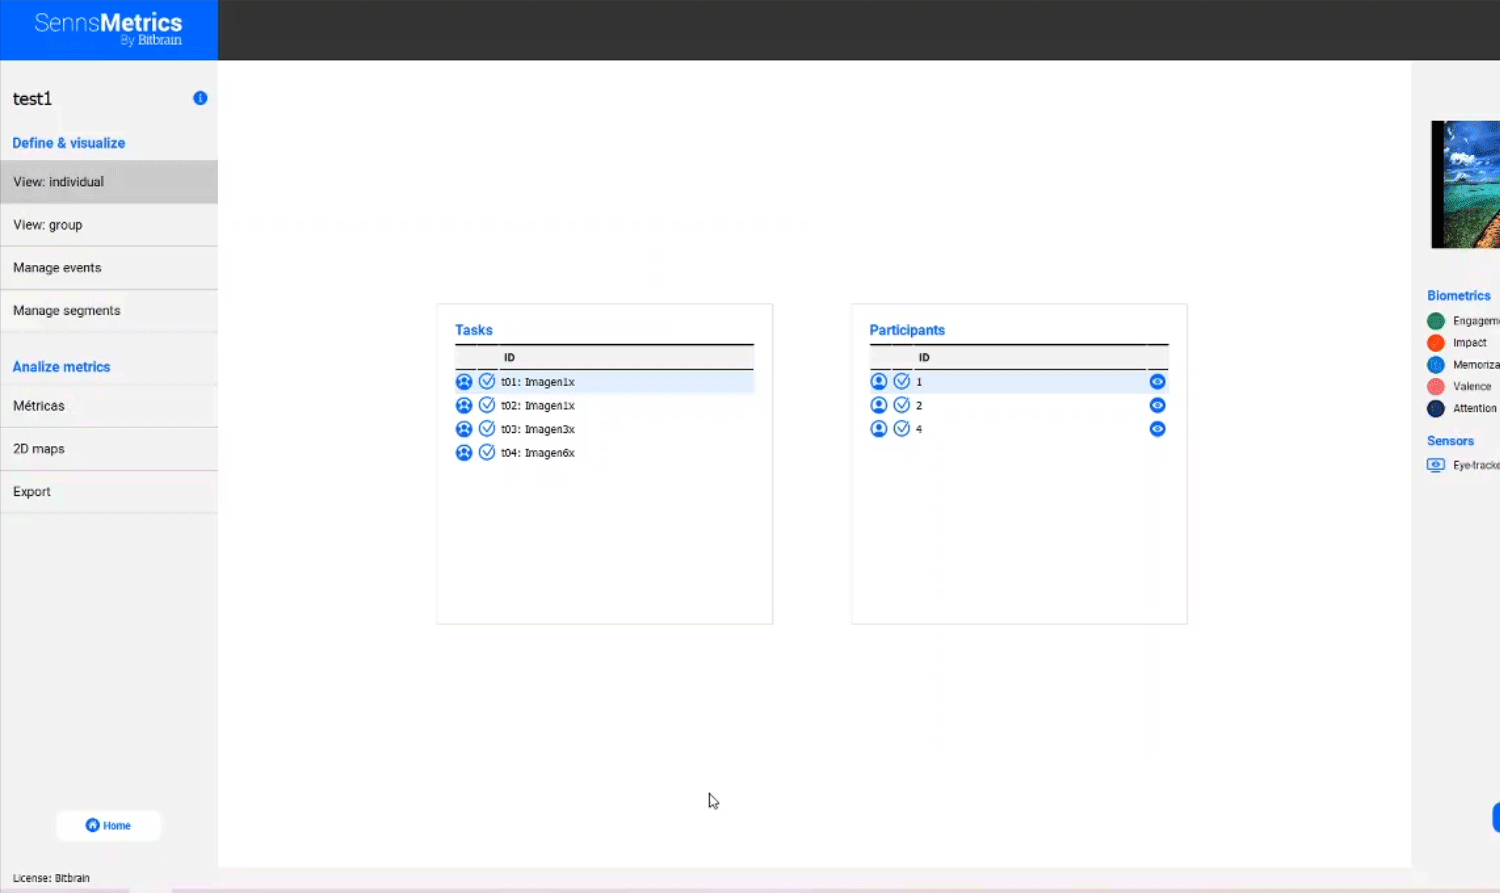
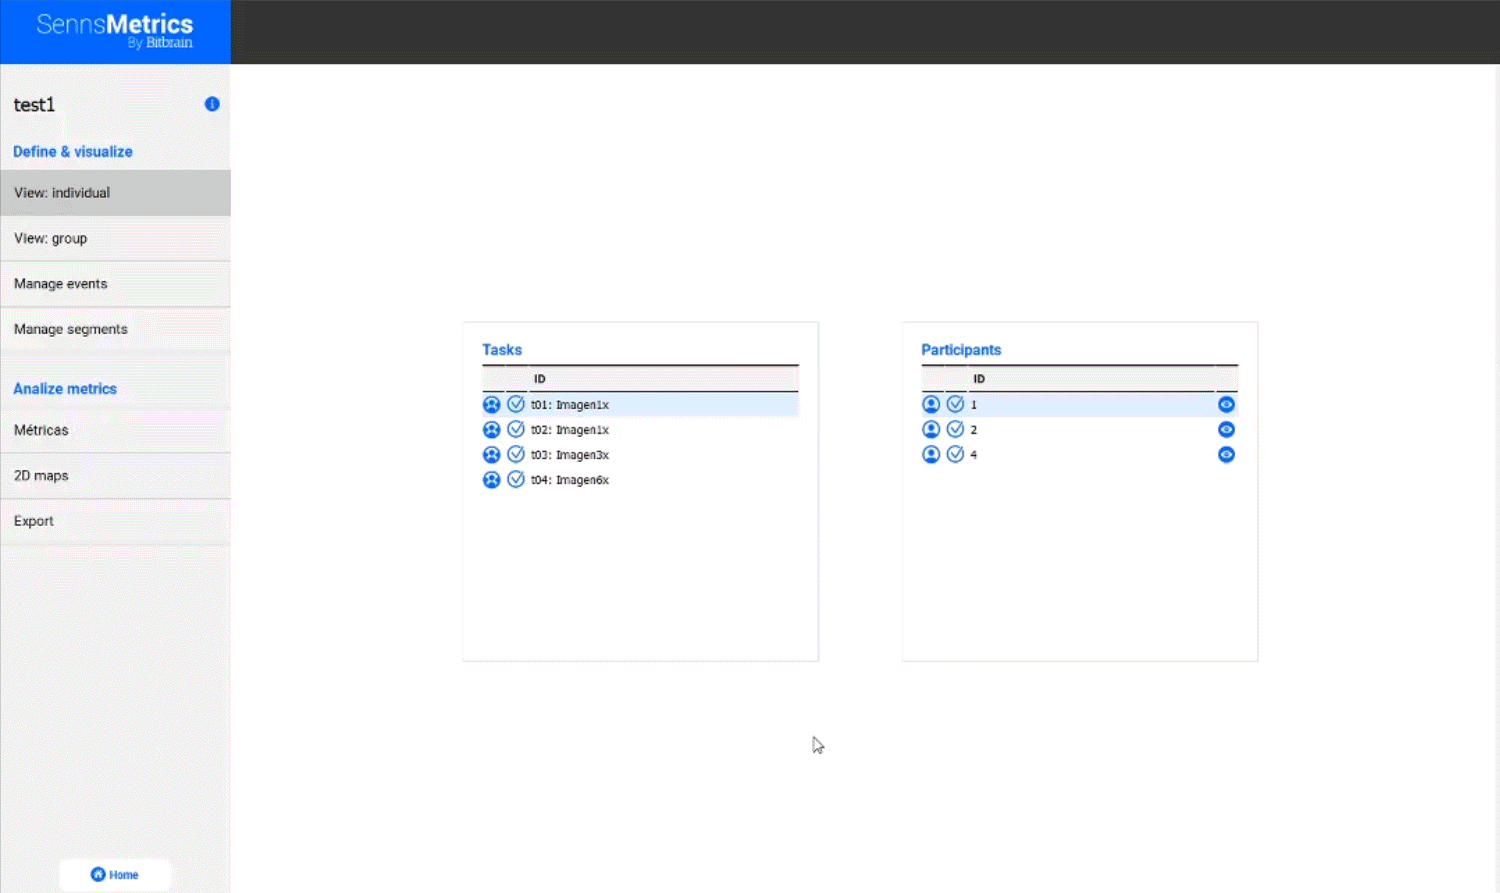
Analysis tools
- Real-time visualization
- Powerful analysis tools
- Individual & aggregated results
- Wide range of biometrics
Biometrics
Workload
Captures the use of cognitive resources to perform a task or visualize a stimulus.
Engagement
Degree of involvement or connection between the person and the stimulus or experience.
Memorization
Intensity of cognitive processes related to the formation of future memories during the presentation of a stimulus.
Valence
Range of attraction experienced during the presence of a stimulus or experience. It varies from a “positive / pleasant” to a “negative / unpleasant”.
Impact
The physiological “jolt” triggered by a specific stimulus.
Emotional activation
Physiological activation produced by an experience in time. It ranges from a state of calm to a state of excitement.
Visual attention
Areas of visual interest. It captures the elements that mainly attract gaze and quantifies consumer’s visual attention.
Implicit associations
Captures the level of comparative association between two concepts and various attributes.
How it works

Output example
A study conducted with EEG, GSR, BVP, and eye tracker.
Results output example - Multimedia Output
Technical specifications
Human Behavior Metrics
Output format
What is included
Support
Basic Support is included during the life time of the product.
- Software updates
- Email support
- Technical assistance
- Knowledge base
Optional Premium support is available.
A step forward in data analysis

SennsMetrics is an extension of the SennsLab software tool which includes the most common study design templates, a wide range of cognitive and emotional biometrics, and a powerful data analysis platform.
Pre-designed studies
Built-in stimuli presentations to speed up the project design by standard and validated experimental protocols.
Wide range of biometrics
Emotional valence, activation and impact, attention, memorisation, engagement, and visual attention.
Powerful visualisation tools
In-depth data analysis with individual and aggregated data with a time resolution of 0.25 sec, with multimedia materials for visualisation.
Flexible and refined analysis tools
Analysis and visualisation tools for further refined analysis of group segmentations, time intervals of interest and visual areas of interest.
Scalability & Integrations
SennsMetrics grows at the same pace you do. Add more sensors, to get access to more metrics and complement your insight into human behavior.
More insights to explore
We invite you to explore our scientific publications section, where you can discover how Bitbrain technology is applied across various research fields.
Scientific Publications

