Quantitative Electroencephalography (QEEG), commonly called brain mapping, is a technique that applies mathematical methods to EEG data, focusing on power spectral analyses. This method generates quantitative metrics related to behavioral and cognitive brain functions.
Comparing an individual's QEEG to a normative database representing the general population (known as the QEEG normative database) can be a valuable diagnostic tool in clinical practice. It helps identify and study disorders like ADHD, schizophrenia, major depression, obsessive-compulsive disorder, and others. Additionally, QEEG is utilized in biomedical research to assess the effects of clinical treatments before and after their application.
In the following post, we will describe QEEG brain mapping and a normative database, how to interpret them, the most reliable electrophysiological markers to date, the main steps and tools needed for the procedure, and some commertial QEEG normative databases.
1. From EEG to QEEG
The electroencephalogram (EEG) records human brain electrical activity using electrodes placed on the scalp. This activity, often referred to as "brain waves" (Niedermeyer, 2005), reflects underlying cortical activity (Niedermeyer, 2005).
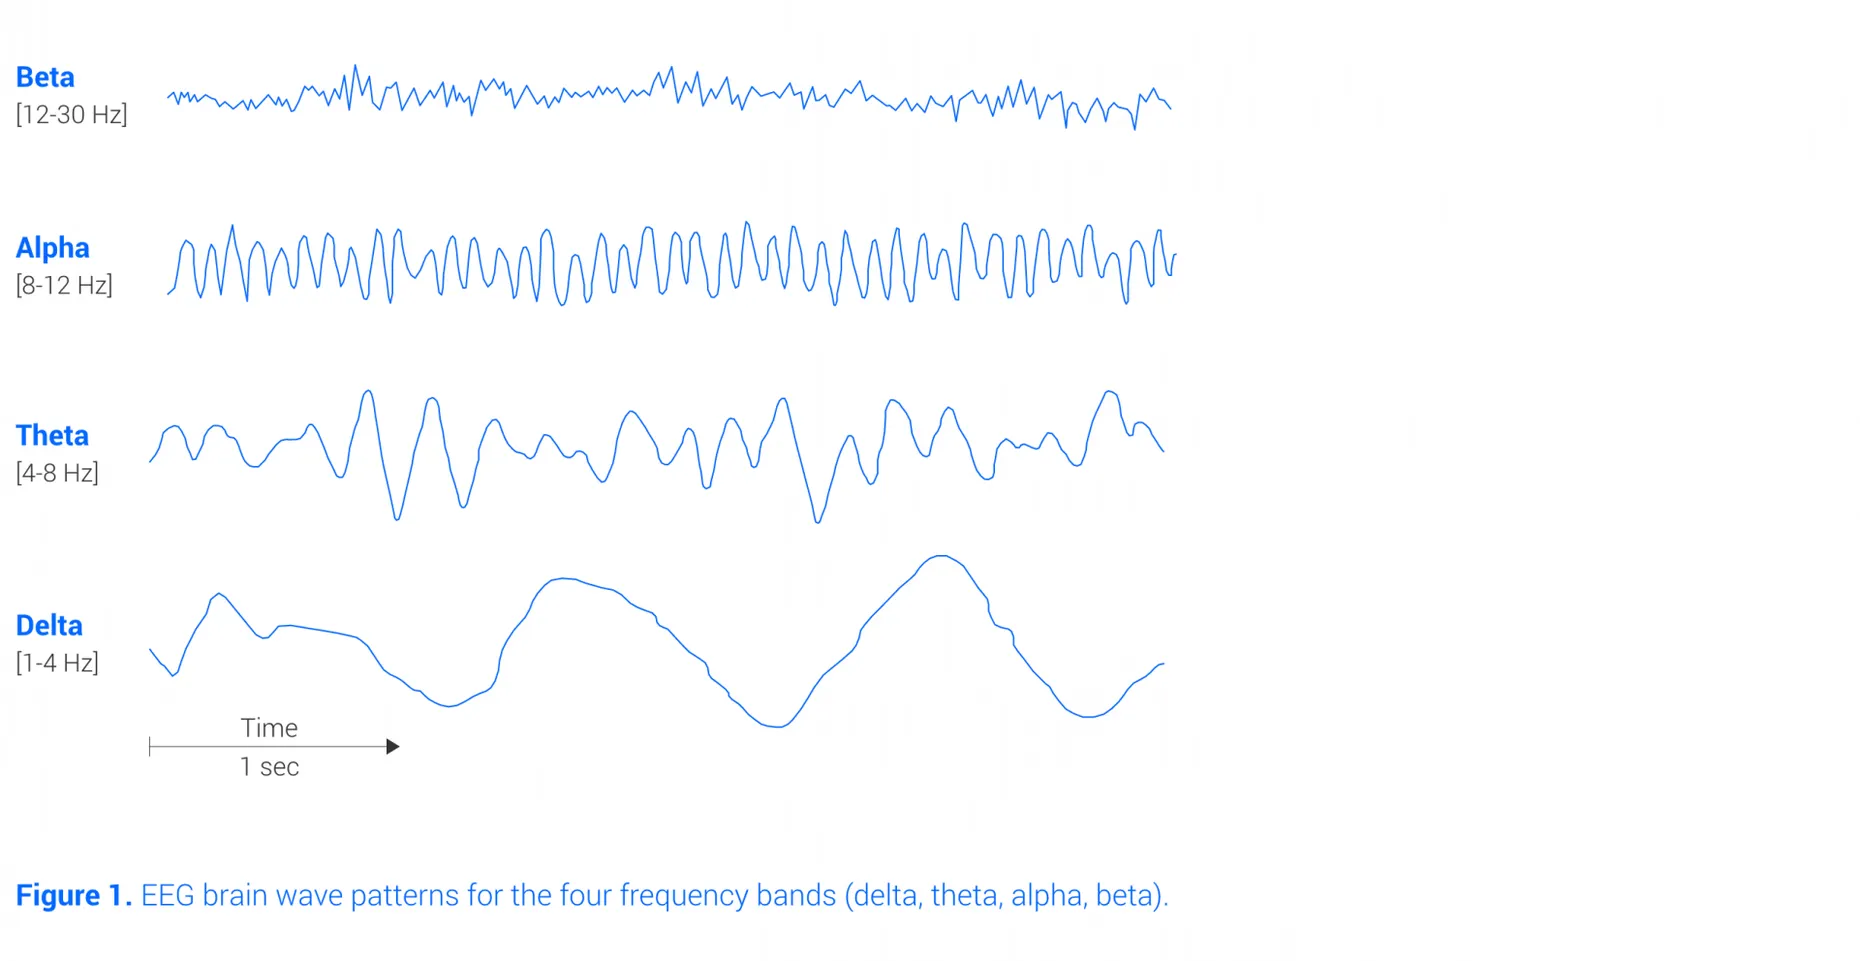
The most studied QEEG metrics are obtained from EEG brain activity and include absolute and relative power in frequency bands, as well as ratios between bands. The most common bands are Delta, Theta, Alpha, and Beta (see Figure 1). They are associated with specific states (Niedermeyer, 2005, Kropotov, 2010).
- Delta band: predominates during deep sleep;
- Theta band: involved in memory encoding and retrieval, and associated with power increases during drowsiness;
- Alpha band: involved in motor functions (over the motor cortex) and cognitive functioning;
- Beta band: indicator of cortical transmission, and associated with power increases during active concentration.
The next Figure shows EEG brain wave patterns for the four frequency bands.
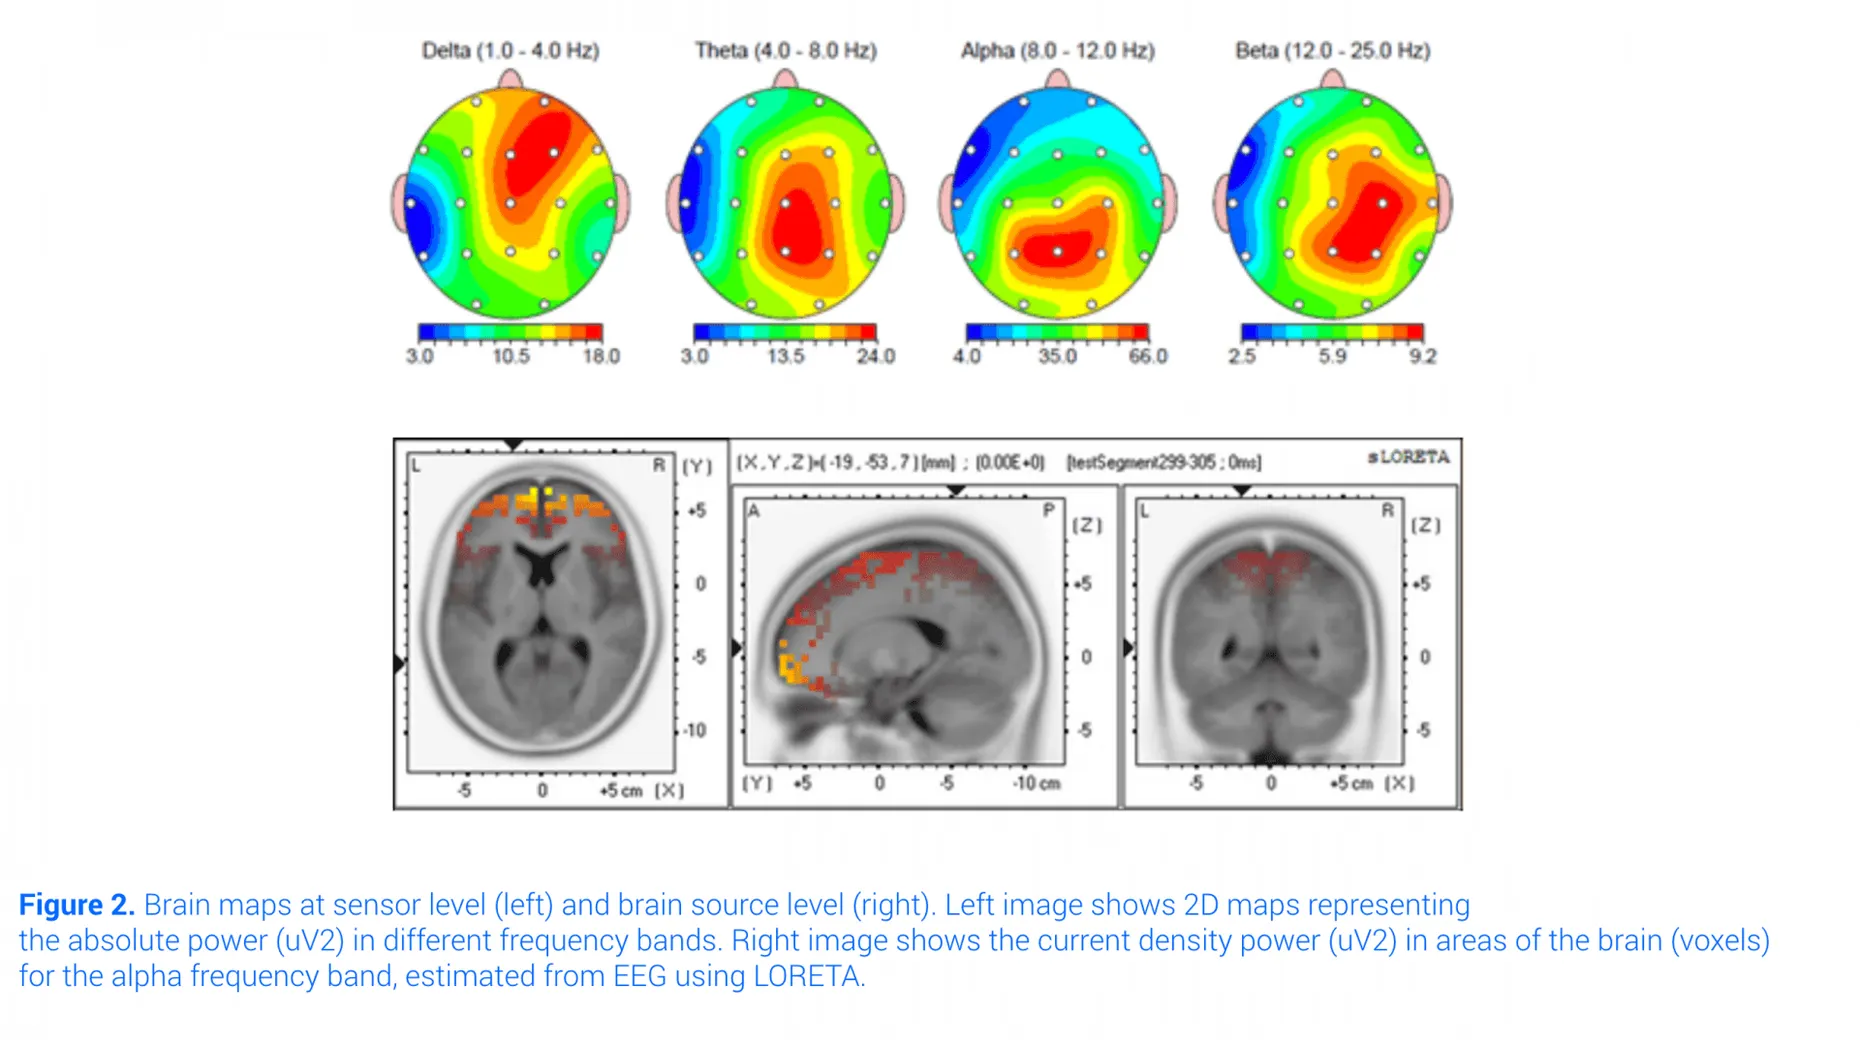
These QEEG metrics are derived from power spectra of electroencephalography EEG data (captured by the EEG sensor layer). There is another set of metrics involving activity in specific brain structures or areas (brain source level). This activity can be estimated from EEG data using source localization techniques. The most widely used technique for this purpose is LORETA (Low-Resolution Electromagnetic Tomography) (Pascual-Marqui, 2002), where QEEG metrics are represented as two- or three-dimensional brain maps (see Figure 2).
2. What is a QEEG normative database?
QEEG (Quantitative Electroencephalography) normative databases serve as a reference or baseline for comparing an individual's EEG data against the average or typical patterns found in the population. By analyzing an individual's EEG data and comparing it to the norms established in the database, clinicians can identify deviations or abnormalities that may be indicative of certain neurological or psychiatric conditions.
A QEEG database is constructed using EEG data collected during periods of both rest and engagement in specific tasks:
- During a resting state recording, the participant remains awake and relaxed, with either eyes closed (EC) or eyes open (EO). These recordings offer the advantage of simplicity and reproducibility across different laboratories.
- An active task involves recording EEG data while the participant performs a perceptual, motor, or cognitive task.
The term "normative" in this context refers to the analytical and statistical procedures used in creating the database to ensure valid comparisons (Thatcher, 2003).
To ensure the robustness of the QEEG database, meticulous inclusion criteria and representative sampling methods are employed. Individuals with a history of neurological problems are excluded, and participant recruitment is meticulously balanced across demographic variables such as gender, age, ethnic background, and socioeconomic status. This meticulous approach guarantees that the resulting database accurately reflects the diversity of the population.
Another critical aspect is amplifier matching. EEG amplifiers exhibit varying frequency characteristics due to differences in filters and gain. Therefore, the QEEG metrics of each individual must be adjusted to align with these characteristics, facilitating accurate comparisons with the database.
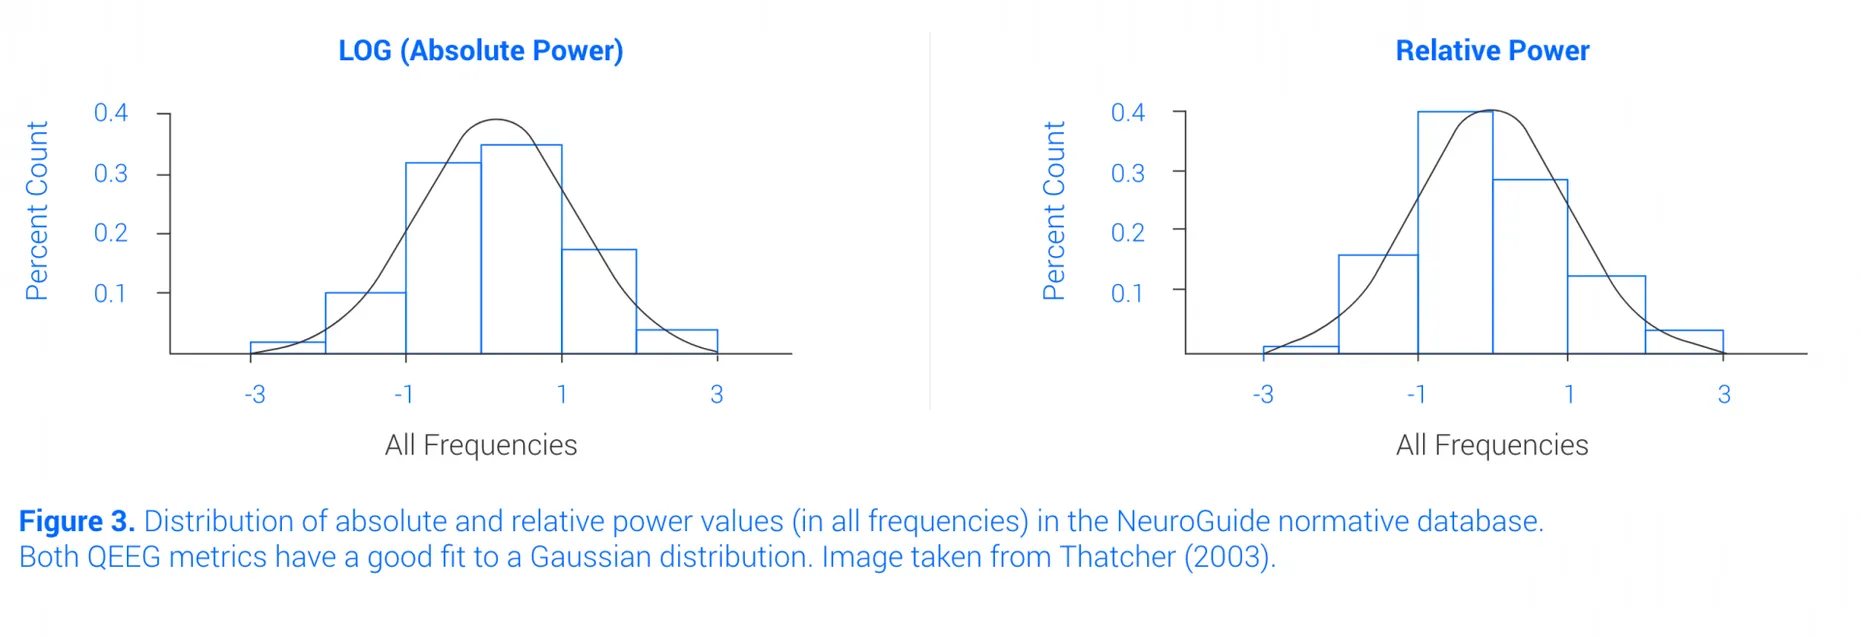
- Furthermore, normative databases employ analytical transformations to aggregate QEEG metrics, approximating them to a Gaussian distribution characterized by mean and standard deviation. This approximation enhances sensitivity and test-retest reliability, as depicted in Figure 3.
3. How to interpret a QEEG?
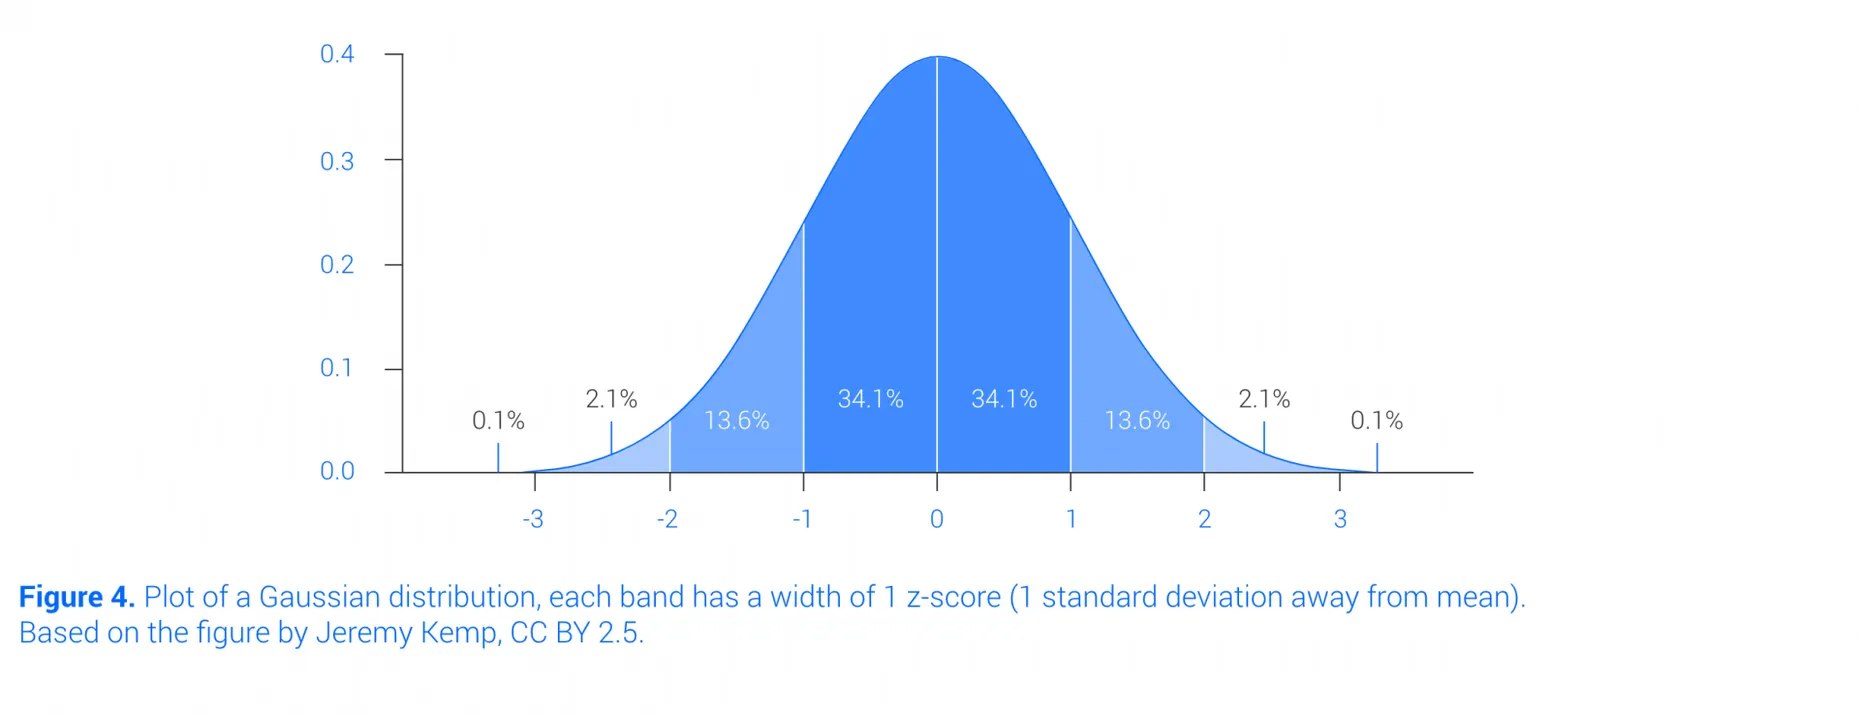
In normative databases, QEEG metrics typically conform to a Gaussian distribution. To gauge an individual's deviation from the population, their z-score is calculated, indicating the number of standard deviations by which their metric differs from the mean. Z-scores exceeding an absolute value of 2 are commonly regarded as atypical, given that 95% of values fall within the [-2, 2] range. Positive z-scores denote an excess of activity, whereas negative z-scores signify a deficit, as illustrated in Figure 4.
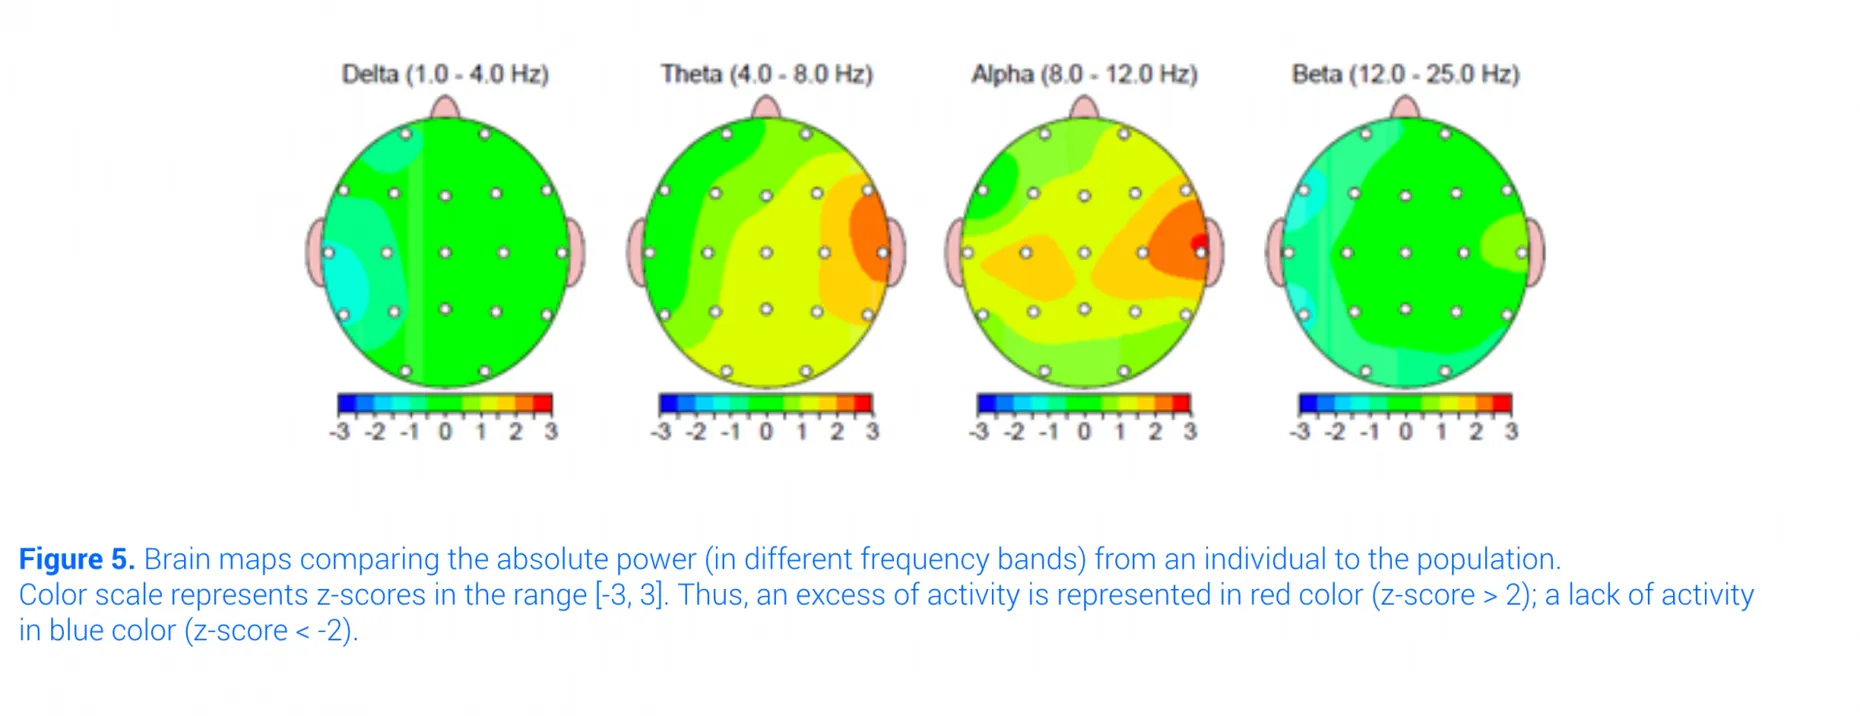
QEEG metrics such as absolute or relative power can be z-scored and represented over two- or three- dimensional brain maps (Figure 5).
4. Electrophysiological markers for certain disorders
Here are some commonly reported QEEG patterns for each disorder:
- ADHD: The most reliable marker is increased absolute power in slow-wave oscillations (delta and theta) and relative theta power during resting states (eyes closed and open), primarily in frontal regions. Reduced power in beta is also observed during eyes-closed resting states. The theta/beta ratio is considered another reliable marker (Barry, 2003; Loo, 2012). Some of the investigation is aimed at enhancing its diagnostic accuracy by integrating quantitative electroencephalography (qEEG) (Ciftci & Alp, 2025).
- Schizophrenia: QEEG analysis typically reveals increased absolute power in slow-wave oscillations (delta and theta) and decreased alpha power during eyes-closed states.
- Depression: The dominant marker is increased absolute power in theta and beta for both eyes-closed and eyes-open conditions. Increased theta power is often observed in the frontal region or specific brain areas (using LORETA). Studies are investigating the use of quantitative EEG (qEEG) to monitor treatment progress and evaluate therapeutic response in patients with Major Depressive Disorder (MDD) (Arıkan et al., 2025).
It's important to note that QEEG is complementary to other clinical observations and requires interpretation by a qualified professional. For a comprehensive review, refer to Newson (2019), Coburn (2006).
5. What are the main steps and tools for QEEG?
QEEG analysis involves three primary steps:
-
EEG recording: Software captures electrical activity during tasks or conditions consistent with the normative database, ensuring at least 60 seconds of artifact-free EEG data (Hughes and John, 1999). The EEG amplifier should align with the normative database. For brain source analysis, employing a high number of sensors distributed across the entire scalp is recommended to ensure accurate estimation (Song, 2016).
-
Artifact rejection: Artifacts refer to signals recorded alongside the EEG that are not neural in origin and are unrelated to the task being performed. These can include physiological factors like cardiac activity, eye movements, and muscle activity, as well as non-physiological factors such as electric interference or loose electrode contact. It's crucial to eliminate these artifacts before conducting QEEG testing.
-
QEEG testing and interpretation: The EEG data is processed, and artifact-free EEG data is compared to the normative database. The results are then interpreted to evaluate any deviations from the norm and their potential clinical significance.
6. Review of commercial QEEG normative databases
Here's a brief review of three quantitative electroencephalogram QEEG normative databases currently available:
-
NeuroGuide (Applied Neuroscience, Inc.): This database includes eyes-closed (EC) and eyes-open (EO) resting-state recordings. It comprises data from 625 individuals spanning from 2 months to 82 years of age. NeuroGuide provides metrics at both sensor and brain source levels, covering absolute/relative power, ratios, peak frequency, asymmetry, and coherence. Extensively studied and documented in scientific literature (Thatcher, 2003; Thatcher, 2009; Thatcher, 2010).
-
qEEG-Pro database (qEEG-Pro B.V.): Offering EC and EO resting-state recordings, this database includes data from 1482 and 1232 individuals for eyes-closed and eyes-open conditions, respectively, within the age range of 6-82. qEEG-Pro adopts a client-side approach, incorporating new individuals progressively through automatic artifact filtering. This database is also FDA registered.
-
HBI database (HBImed AG): In addition to EC and EO resting-state recordings, this database features five active tasks, including GO/NOGO tasks, arithmetic and reading tasks, auditory recognition, and auditory oddball tasks. It comprises data from 300 children and adolescents (age 7-17), 500 adults (18-60), and 200 seniors (age 61+).
7. Can I do a QEEG with any existing EEG hardware?
Definitely not.
Each individual EEG hardware must undergo calibration to the database. This is to account for measurement differences between the current amplifier and the amplifier that originally collected the EEG data in the database. This calibration process, known as amplifier matching, is carried out by the manufacturer of the database. Once completed, the EEG hardware is considered supported by the QEEG database.
In this direction, Bitbrain has worked with Applied Neuroscience to include the Versatile EEG 16 and 32 sensors in the QEEG normative database (Neuroguide). Note that the recording with 32 sensors allows obtaining metrics at brain source level using source location techniques (LORETA).
About Bitbrain solutions
Bitbrain specializes in developing innovative devices with excellent usability for multimodal monitoring, encompassing semi-dry EEG, dry-EEG, and textile-EEG systems, as well as biosignals (ExG, GSR, RESP, TEMP, IMUs, etc.), and eye-tracking solutions (screen-based and mobile platforms).
The software tools facilitate the design of experiments, effortless data gathering with over 35 synchronized sensor types, and extensive data analysis covering a broad spectrum of emotional and cognitive biometrics.
Bitbrain's platforms offer interconnectivity with other systems through LSL, ePrime, Matlab, or Python, providing flexibility and compatibility for diverse research and application needs.
Our systems are used by scientists in high-impact and peer-reviewed publications in a wide range of research applications, including neuroscience, psychology, education, human factors, market research and neuromarketing, and brain-computer interfacing.
References
- Arıkan, M. K., Gıca, Ş., İlhan, R., Orhan, Ö., Kalaba, Ö., & Günver, M. G. (2025). Monitoring the response of treatment in major depressive disorder with EEG: Could it be an indicator of returning to health in responders. Clinical EEG and Neuroscience, 0(0). DOI:10.1177/15500594241310949
- Barry, R. J., Clarke, A. R., & Johnstone, S. J. (2003). A review of electrophysiology in attention-deficit/hyperactivity disorder: I. Qualitative and quantitative electroencephalography. Clinical neurophysiology, 114(2), 171-183. DOI:10.1016/S1388-2457(02)00362-0
- Ciftci, E. and Alp, Z.B. (2025), Quantitative EEG Insights Into A Hundred Adult ADHD Patients: A Deep Dive Into Test of Variables of Attention (TOVA) Correlations and Attention Dynamics. CNS Neurosci Ther, 31: e70304. DOI:10.1111/cns.70304
- Coburn, K.L, Lauterbach, E.C., Boutros, N.N., Black, K.J., Arciniegas, D.B., Coffey, C. E (2006). The value of quantitative electroencephalography in clinical psychiatry: a report by the Committee on Research of the American Neuropsychiatric Association. The Journal of neuropsychiatry and clinical neurosciences 18 (4), 460-500. DOI:10.1176/jnp.2006.18.4.460
- Evans, J. R., & Abarbanel, A. (Eds.). (1999). Introduction to quantitative EEG and neurofeedback. Elsevier.
- Hughes, J. R., & John, E. R. (1999). Conventional and quantitative electroencephalography in psychiatry. The Journal of Neuropsychiatry and Clinical Neurosciences, 11(2), 190-208.
Johnstone, J., & Gunkelman, J. (2003). Use of databases in QEEG evaluation. Journal of Neurotherapy, 7(3-4), 31-52. DOI:10.1176/jnp.11.2.190 - Keizer, A. W. (2019). Standardization and Personalized Medicine Using Quantitative EEG in Clinical Settings. Clinical EEG and neuroscience, 1550059419874945.
- Kropotov, J. D. (2010). Quantitative EEG, event-related potentials and neurotherapy. Academic Press.
- Loo, S. K., & Makeig, S. (2012). Clinical utility of EEG in attention-deficit/hyperactivity disorder: a research update. Neurotherapeutics, 9(3), 569-587.
- Lorensen, T. D., & Dickson, P. (2003). Quantitative EEG normative databases: A comparative investigation. Journal of Neurotherapy, 7(3-4), 53-68.
- Newson, J. J., & Thiagarajan, T. C. (2019). EEG frequency bands in psychiatric disorders: a review of resting state studies. Frontiers in human neuroscience, 12, 521.
- Niedermeyer, E., & da Silva, F. L. (Eds.). (2005). Electroencephalography: basic principles, clinical applications, and related fields. Lippincott Williams & Wilkins.
- Nuwer, M. (1997). Assessment of digital EEG, quantitative EEG, and EEG brain mapping: report of the American Academy of Neurology and the American Clinical Neurophysiology Society. Neurology, 49(1), 277-292.
- Pascual-Marqui, R. D. (2002). Standardized low-resolution brain electromagnetic tomography (sLORETA): technical details. Methods Find Exp Clin Pharmacol, 24(Suppl D), 5-12.
- Song, J., Davey, C., Poulsen, C., Luu, P., Turovets, S., Anderson, E., ... & Tucker, D. (2015). EEG source localization: sensor density and head surface coverage. Journal of neuroscience methods, 256, 9-21. DOI:10.1016/j.jneumeth.2015.08.015
- Thatcher, R. W., & Lubar, J. F. (2009). History of the scientific standards of QEEG normative databases. Introd. Quant. EEG Neurofeedback, 2009, 29-59. DOI:10.1016/B978-0-12-374534-7.00002-2
- Thatcher, R. W., Walker, R. A., Biver, C. J., North, D. N., & Curtin, R. (2003). Quantitative EEG normative databases: Validation and clinical correlation. Journal of Neurotherapy, 7(3-4), 87-121. DOI:10.1300/J184v07n03_05
- Thatcher, R. W. (2010). Validity and reliability of quantitative electroencephalography. Journal of Neurotherapy, 14(2), 122-152. DOI: 10.1080/10874201003773500
Related resources:
- EEG Electrode Placement Options: Learn how and where to position electrodes on the scalp for accurate and reliable EEG recordings.
- All about EEG artifacts and filtering tools: Discover what EEG artifacts are, their most common causes, and how to identify or minimize them.
- The Use of EEG for ADHD Diagnosis and Treatment: Discover how EEG is used to assess and understand ADHD from a neurophysiological perspective.
- EEG Synchronization With Other Biosensors (EEG, ECG, EMG, eye tracking, etc.), and Software: Understand what neural synchronization in EEG is and why it matters for studying brain connectivity.
- How Deep Learning is changing machine learning AI in EEG data processing: How deep learning and AI are transforming EEG signal analysis, from preprocessing to real-time brain decoding.
- What is EEG and what is it used for?: A beginner-friendly introduction to EEG: how it works, its main applications in medicine and research, and the types of devices available.
- How to Select a Dry-EEG Headset for your Research Application: A practical guide to choosing the right dry-EEG headset based on your research stage, application needs, and key technical features.
- EEG and Virtual Reality: The Neuroadaptive Future of Neurotechnology: Learn about applications combining EEG and virtual reality in research and immersive experiences.
- The Wet EEG Cap: Water, Saline, and Gel Differences: Everything you need to know about traditional wet EEG caps, from preparation and conductive gel application to maintenance and when they are the optimal choice for your study.
- Main Features of the EEG Sensor Layer Explained: Learn about the sensor layer in EEG devices: types, materials, and their impact on signal quality.